A. Current Hall of Famers and Statistics
I. Position Players
II. Starting Pitchers
III. Relief Pitchers

Hall of Fame Composite
I. Position Players
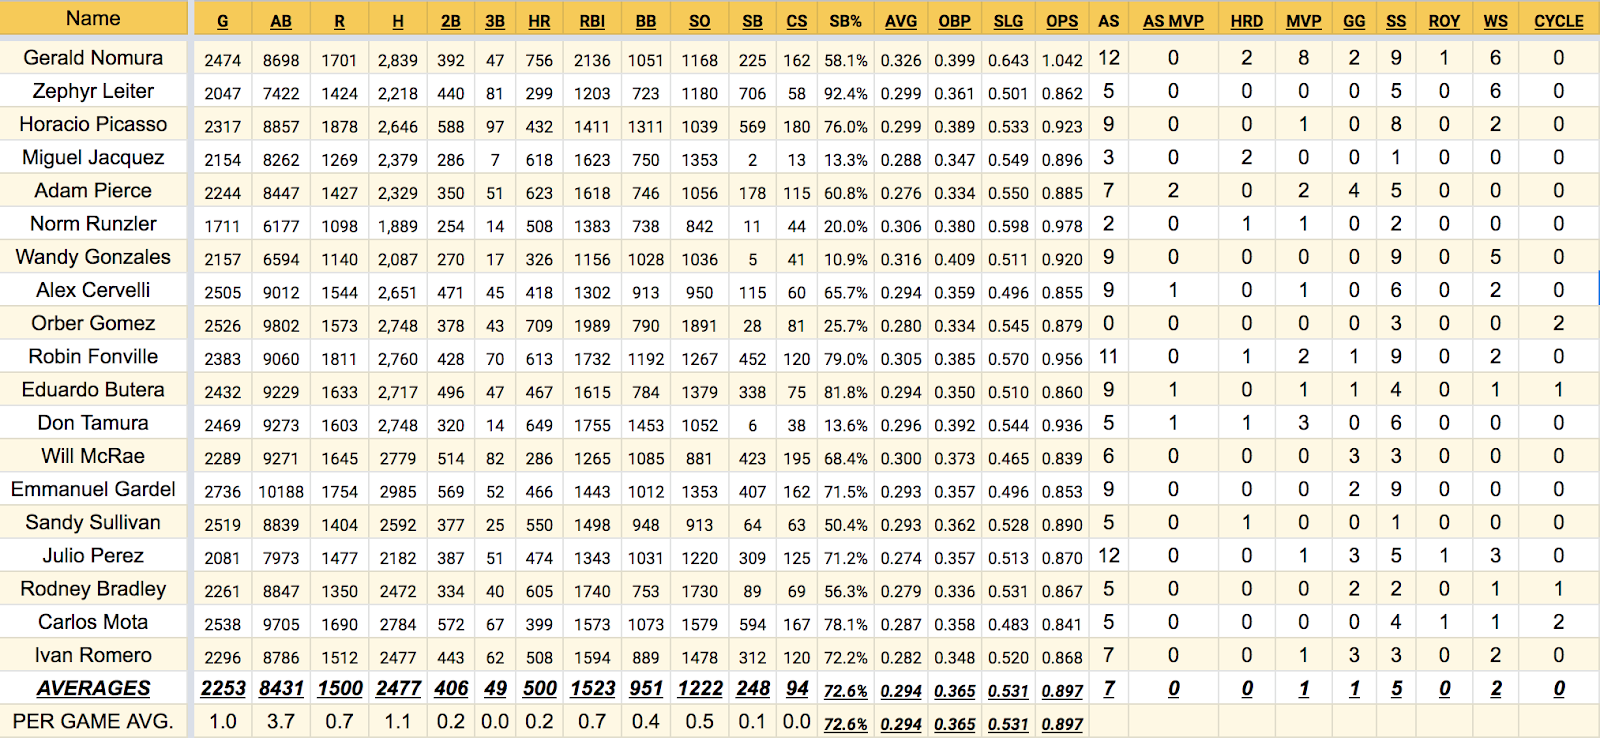
The average Hall of Fame position player was a heart of the order hitter, with 2,477 hits, 406 doubles, 500 home runs, 1,523 RBI and a 0.897 on base plus slugging (OPS, excluding hit by pitch or sacrifice data). Additionally, the average Hall of Fame position player made seven All Star appearances, won one MVP, one Gold Glove, five Silver Sluggers, and won two World Series rings.
On a per game basis, the average Hall of Fame position player accrued 1.1 hits in 3.7 at bats, doubled and homered at roughly equivalent rates (0.2 each), scored and batted in 0.7 run, and walked 0.4 times compared with 0.5 strike outs.
II. Starting Pitchers
I. Position Players
II. Starting Pitchers
III. Relief Pitchers
Hall of Fame Composite
I. Position Players
The average Hall of Fame position player was a heart of the order hitter, with 2,477 hits, 406 doubles, 500 home runs, 1,523 RBI and a 0.897 on base plus slugging (OPS, excluding hit by pitch or sacrifice data). Additionally, the average Hall of Fame position player made seven All Star appearances, won one MVP, one Gold Glove, five Silver Sluggers, and won two World Series rings.
On a per game basis, the average Hall of Fame position player accrued 1.1 hits in 3.7 at bats, doubled and homered at roughly equivalent rates (0.2 each), scored and batted in 0.7 run, and walked 0.4 times compared with 0.5 strike outs.
II. Starting Pitchers
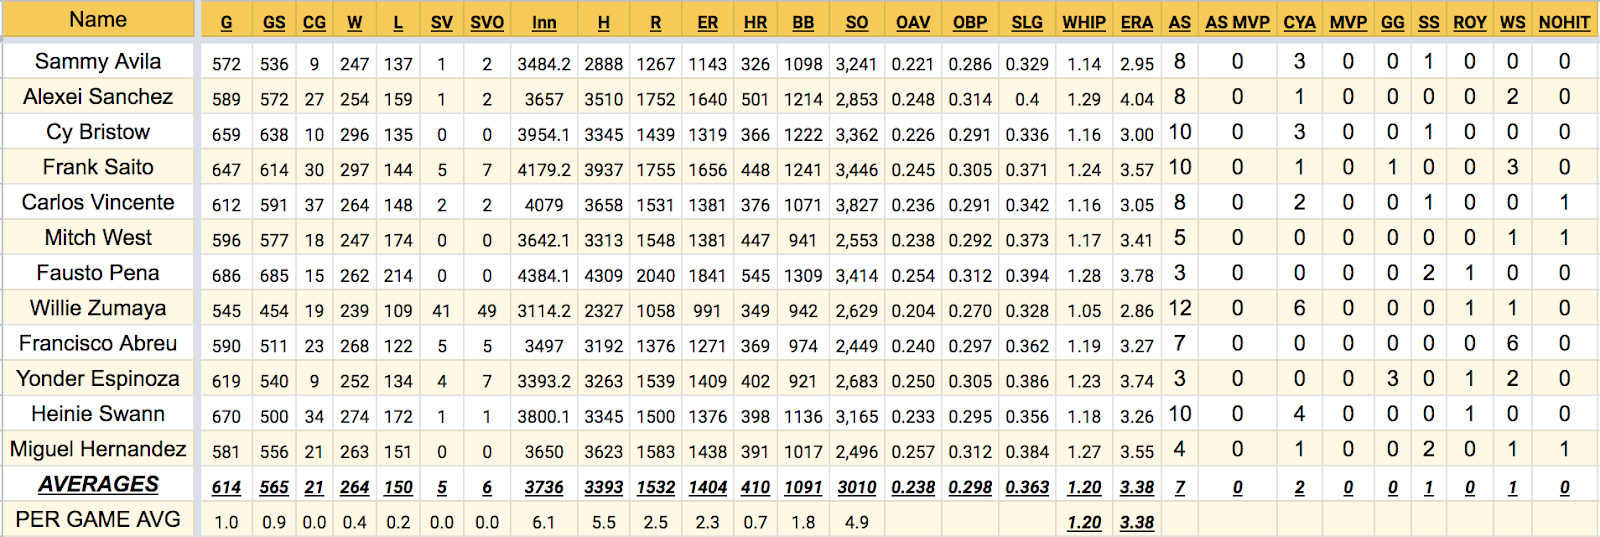
The average Hall of Fame starting pitcher demonstrated excellent control, winning 264 games and losing 150, collecting 3,010 strikeouts against just 1,091 walks, and throwing to a 1.20 WHIP and 3.38 ERA. The average SP made seven All Star appearances, won two Cy Young Awards, one Silver Slugger, and one World Series ring.
On a per game basis, the average Hall of Fame starting pitcher went six innings, allowed 5.5 hits, 1.8 walks, and 2.3 earned runs while striking out 4.9.
III. Relief Pitchers
The average Hall of Fame relief pitcher was a reliable back-end bullpen arm, averaging 467 saves out of 548 opportunities (85.2%) in 989 total appearances. He allowed 1.19 baserunners per inning pitched and kept a 3.17 ERA. He averaged eight All Star appearances, three Fireman of the Year awards, and one World Series ring.
On a per game basis, the average Hall of Fame reliever pitched an inning and a third, allowed a hit, 0.4 walks and 0.4 earned runs, and struck out 0.9.
B. Hall of Fame Nominees and Statistics
I. Position Players

II. Starting Pitchers
III. Relief Pitchers

Comparison
Clearly, the averages for all three groups are significantly lower than our current group of Hall of Famers in virtually every category. However, several players rank as above average, compared with current Hall of Famers, in various categories, including some who would rank in the Top 5 of some categories if elected. Those will be outlined below.
Additionally, I included per game averages, in order to capture how these players stack up with the Hall of Famers. Theoretically, this could capture somebody whose career was not long enough to reach certain counting milestones, e.g. 300 wins, but who had a strong peak during which they were one of the best in the league.
In the meantime, it is important to remember that these are averages: some people fall above, and some people fall below, including current Hall of Famers. Simply falling below the average should not be the sole basis for exclusion. I encourage all owners to look at player holistically and vote on the merits.
Above Average Position Players
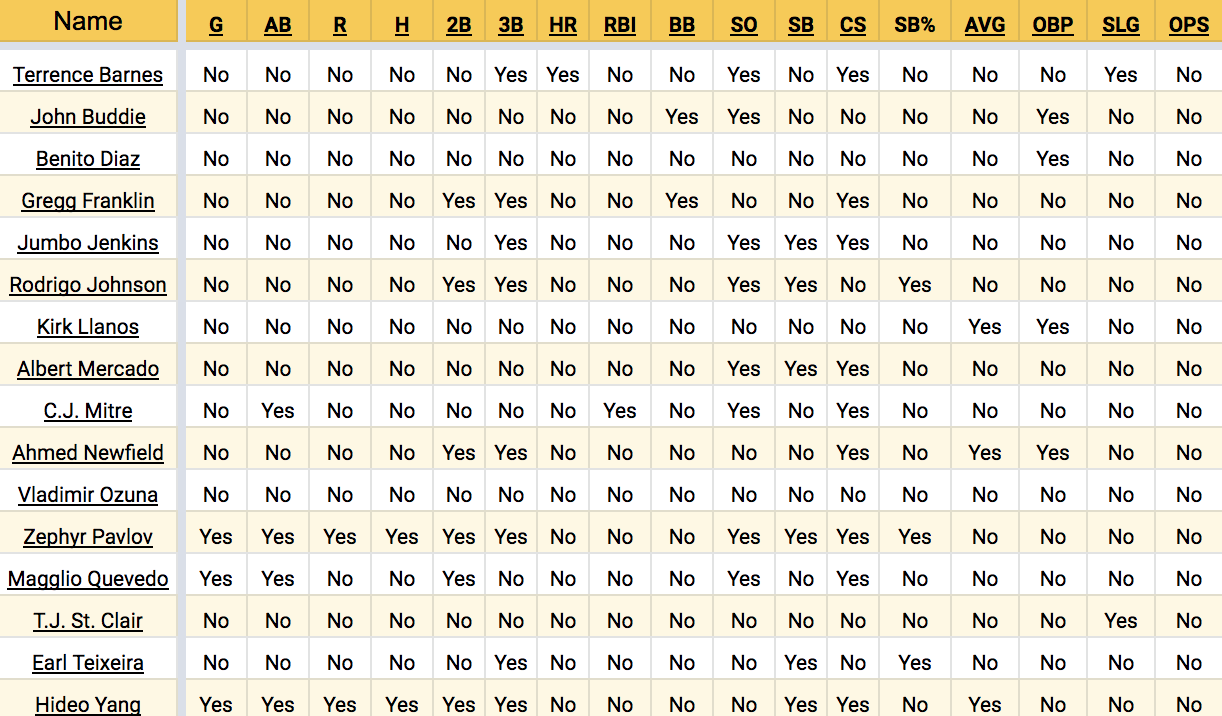
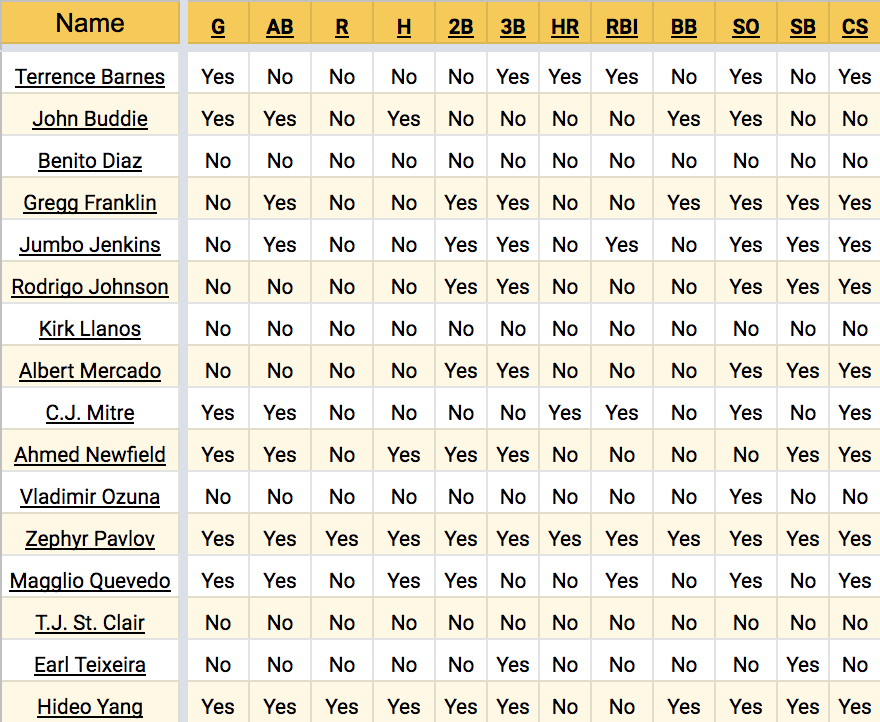
The tables below list each nominated position player and whether or not they were above average in a given category, when compared to current Hall of Famers, on both an absolute and per game basis.
Above Average When Compared with Hall of Famer Statistical Averages
Above Average When Compared with Hall of Famer Award Averages

Above Average When Compared with Hall of Famer Per Game Averages
Above Average Starting Pitchers
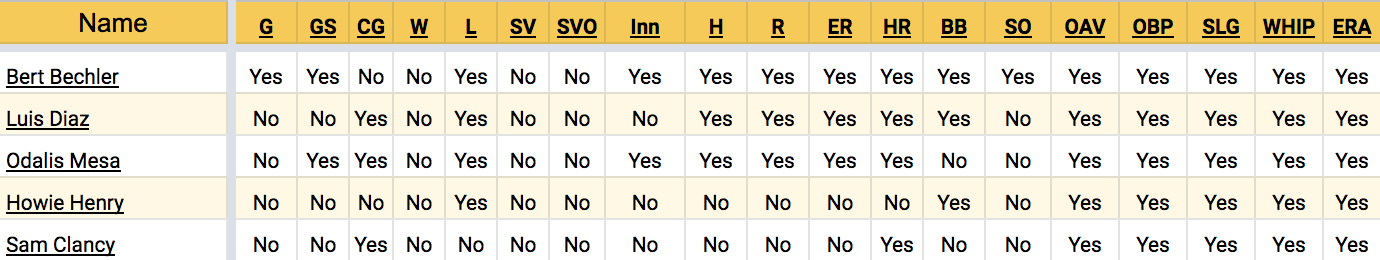
The tables below list each nominated starting pitcher and whether or not they were above average in a given category, when compared to current Hall of Famers, on both an absolute and per game basis.
Above Average When Compared with Hall of Famer Statistical Averages
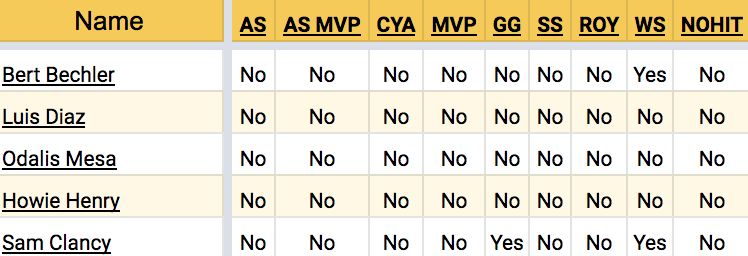
Above Average When Compared with Hall of Famer Award Averages
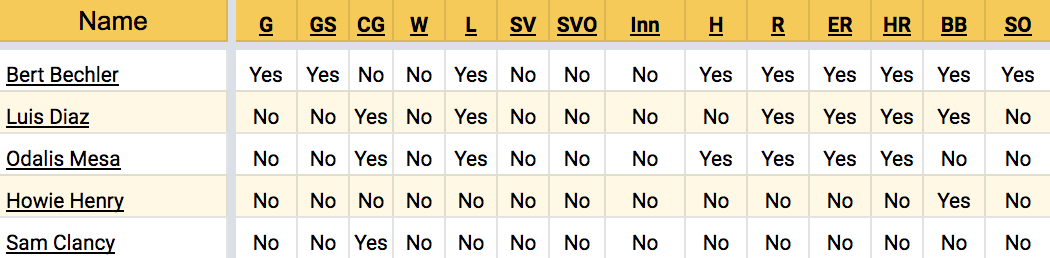
Above Average When Compared with Hall of Famer Per Game Averages
Above Average Relief Pitchers
The tables below list each nominated relief pitcher and whether or not they were above average in a given category, when compared to current Hall of Famers, on both an absolute and per game basis.
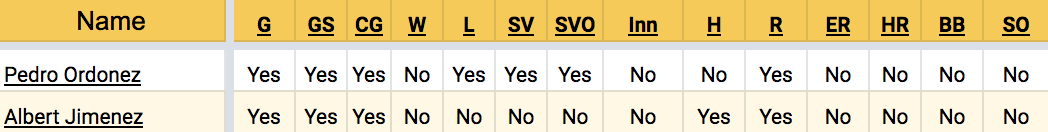
Above Average When Compared with Hall of Famer Statistical Averages

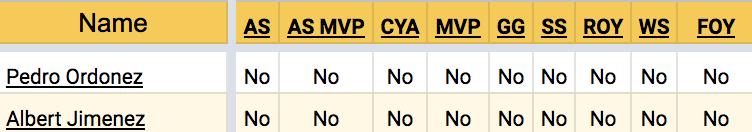
Above Average When Compared with Hall of Famer Award Averages
Above Average When Compared with Hall of Famer Per Game Averages
C. Analysis
The tables below list each nominated position player and whether or not they were above average in a given category, when compared to current Hall of Famers, on both an absolute and per game basis.
Above Average When Compared with Hall of Famer Statistical Averages
Above Average When Compared with Hall of Famer Award Averages
Above Average When Compared with Hall of Famer Per Game Averages
Above Average Starting Pitchers
The tables below list each nominated starting pitcher and whether or not they were above average in a given category, when compared to current Hall of Famers, on both an absolute and per game basis.
Above Average When Compared with Hall of Famer Statistical Averages
Above Average When Compared with Hall of Famer Award Averages
Above Average When Compared with Hall of Famer Per Game Averages
Above Average Relief Pitchers
The tables below list each nominated relief pitcher and whether or not they were above average in a given category, when compared to current Hall of Famers, on both an absolute and per game basis.
Above Average When Compared with Hall of Famer Statistical Averages
Above Average When Compared with Hall of Famer Award Averages
Above Average When Compared with Hall of Famer Per Game Averages
C. Analysis
Position Players
Among nominated position players, Hideo Yang and Zephyr Pavlov lead the field in terms of categories in which they surpass the Hall of Fame statistical and award averages, with 10 each. Ahmed Newfield and John Buddie are next with eight a piece, followed by Rodrigo Johnson and C.J. Mitre with six.
On a per game basis, however, Pavlov clearly leads the pack with 12, followed by Yang with 10, and then Gregg Franklin, Jumbo Jenkins, Magglio Quevedo, and Newfield with 7.
Only five players average more hits per game than the current Hall of Famers: Yang, Pavlov, Quevedo, Newfield, and Buddie. Three average more home runs: Pavlov, Mitre, and Terrence Barnes. Just five average more RBI per game: Barnes, Jenkins, Mitre, Pavlov, and Quevedo.
Only Buddie and Johnson met the average number of All Star appearances by current Hall of Famers, with seven. Jenkins was right behind them with six. Nobody else had more than four.
The only nominee to win an MVP was Pavlov, who did it just once. Buddie, Newfield, and Jenkins lead all nominees with Silver Sluggers (6, 5, and 4, respectively).
Starting Pitchers
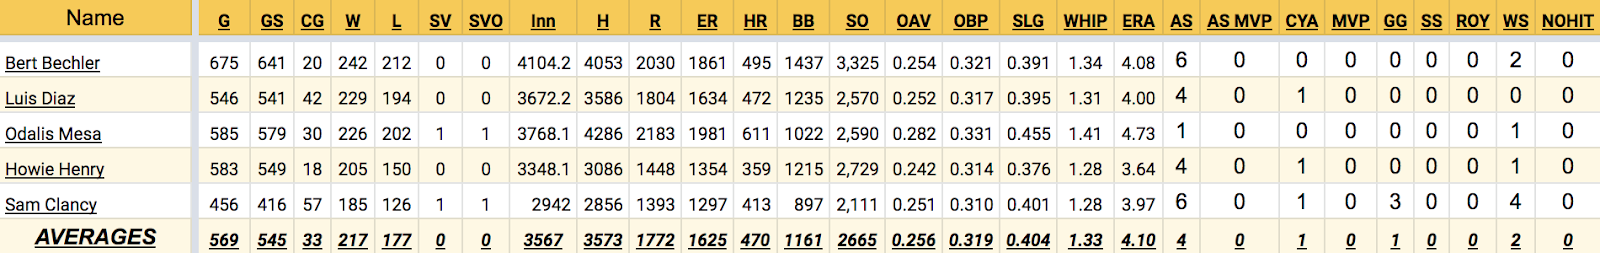
None of the starting pitchers in this year’s class of nominees rank above average in terms of wins, although four of the five did lose more games than the average Hall of Fame starter. Sam Clancy is the only not to have done so. All five starters have worse opponent averages, opponent on base percentages, opponent slugging percentages, WHIPs, and ERAs than the average Hall of Fame starter, as well.
Despite that, Bert Bechler and Odalis Mesa both pitched more innings than the average Hall of Fame starter, and Bechler has the distinction of being the only starter in this year’s class with more strikeouts than the average Hall of Famer - as well as the only in this year’s class with more than 3,000, a feat that only four Hall of Famers have achieved.
Bechler and Clancy came closest to the average number of All Star appearances among current Hall of Famers (7) with six each. Similarly, Clancy, Luis Diaz, and Howie Henry each won one Cy Young Award, falling just short of the average for current Hall of Famers (2). The only current nominee, however, actually to beat any award average among current Hall members was Clancy, on the strength of his three Gold Gloves.
On a per game basis, no starting pitcher was demonstrably better than those currently in the Hall, with the exception of Bechler striking out more hitters per game.
Relief Pitchers
Among relievers, Pedro Ordonez was the only closer to have saved more games than the average Hall of Famer, and at a higher rate (86.3%). Conversely, Albert Jimenez spent more time as a set up man, with more appearances than the average reliever, despite fewer saves and opportunities.
Neither pitcher accrued accolades to the same level as current Hall of Famers, with Ordonez winning the only Fireman of the Year award among the two, though Ordonez and Jimenez both made their share of All Star games, attending six and three, respectively. Opponents also fared better against both closers, although Ordonez successfully limited extra base hits at a better rate than the average Hall of Famer.
On a per game basis, neither pitcher was demonstrably better than those closers already enshrined.
D. Hall of Fame Benchmarks
Among hitters, a number of statistical benchmarks appear to be coalescing. I made a determination on these by calculating the number at or above which 75% of current Hall of Famers ended their careers.
The position player benchmarks are as follows:
Therefore, one might expect that any position player accruing at least these statistics and winning at least this amount of awards, would have a good shot at being elected to the Hall of Fame.
The benchmarks for starting pitchers are as follows:
* These categories were determined using the third quartile, i.e. finding the level at this 75% of Hall of Famers fell at or below over their career.
Therefore, one might expect that any starting pitcher accruing at least these statistics and winning at least this amount of awards, would have a good shot at being elected to the Hall of Fame.
On a per game basis, however, Pavlov clearly leads the pack with 12, followed by Yang with 10, and then Gregg Franklin, Jumbo Jenkins, Magglio Quevedo, and Newfield with 7.
Only five players average more hits per game than the current Hall of Famers: Yang, Pavlov, Quevedo, Newfield, and Buddie. Three average more home runs: Pavlov, Mitre, and Terrence Barnes. Just five average more RBI per game: Barnes, Jenkins, Mitre, Pavlov, and Quevedo.
Only Buddie and Johnson met the average number of All Star appearances by current Hall of Famers, with seven. Jenkins was right behind them with six. Nobody else had more than four.
The only nominee to win an MVP was Pavlov, who did it just once. Buddie, Newfield, and Jenkins lead all nominees with Silver Sluggers (6, 5, and 4, respectively).
Starting Pitchers
None of the starting pitchers in this year’s class of nominees rank above average in terms of wins, although four of the five did lose more games than the average Hall of Fame starter. Sam Clancy is the only not to have done so. All five starters have worse opponent averages, opponent on base percentages, opponent slugging percentages, WHIPs, and ERAs than the average Hall of Fame starter, as well.
Despite that, Bert Bechler and Odalis Mesa both pitched more innings than the average Hall of Fame starter, and Bechler has the distinction of being the only starter in this year’s class with more strikeouts than the average Hall of Famer - as well as the only in this year’s class with more than 3,000, a feat that only four Hall of Famers have achieved.
Bechler and Clancy came closest to the average number of All Star appearances among current Hall of Famers (7) with six each. Similarly, Clancy, Luis Diaz, and Howie Henry each won one Cy Young Award, falling just short of the average for current Hall of Famers (2). The only current nominee, however, actually to beat any award average among current Hall members was Clancy, on the strength of his three Gold Gloves.
On a per game basis, no starting pitcher was demonstrably better than those currently in the Hall, with the exception of Bechler striking out more hitters per game.
Relief Pitchers
Among relievers, Pedro Ordonez was the only closer to have saved more games than the average Hall of Famer, and at a higher rate (86.3%). Conversely, Albert Jimenez spent more time as a set up man, with more appearances than the average reliever, despite fewer saves and opportunities.
Neither pitcher accrued accolades to the same level as current Hall of Famers, with Ordonez winning the only Fireman of the Year award among the two, though Ordonez and Jimenez both made their share of All Star games, attending six and three, respectively. Opponents also fared better against both closers, although Ordonez successfully limited extra base hits at a better rate than the average Hall of Famer.
On a per game basis, neither pitcher was demonstrably better than those closers already enshrined.
D. Hall of Fame Benchmarks
Among hitters, a number of statistical benchmarks appear to be coalescing. I made a determination on these by calculating the number at or above which 75% of current Hall of Famers ended their careers.
The position player benchmarks are as follows:
The benchmarks for starting pitchers are as follows:
Therefore, one might expect that any starting pitcher accruing at least these statistics and winning at least this amount of awards, would have a good shot at being elected to the Hall of Fame.
The benchmarks for relief pitchers are as follows:
* These categories were determined using the third quartile, i.e. finding the level at this 75% of Hall of Famers fell at or below over their career.
Therefore, one might expect that any starting pitcher accruing at least these statistics and winning at least this amount of awards, would have a good shot at being elected to the Hall of Fame.
Therefore, one might expect that any starting pitcher accruing at least these statistics and winning at least this amount of awards, would have a good shot at being elected to the Hall of Fame.
E. Notes and Lingering Questions
It’s easy for us to think of our Hall of Famers in the context of Major League Baseball: 3,000 hits, 300 wins. The fact of the matter, though, is that longevity in Hardball Dynasty is highly variable, and a career that lasts longer than a solid decade is hard to come by. Despite this, Upper Deck has a long history and we have, through our voting patterns, determined what benchmarks, on average, we deem to be worthy of enshrinement.
Many of the players in this year’s class do happen to fall below Upper Deck’s own historical averages. That said, the way that we vote this year will shift those averages in one direction or another, and just because a player is below those numbers does not mean he is not worthy.
How long was the player’s peak? How strong was it?
No Hall of Fame pitcher has ever won the Most Valuable Player award. Should a starter who wins the MVP be a shoo-in for enshrinement? Should a reliever who wins the Cy Young be a shoo-in?
Could a shut down reliever who never closed games be elected?
Only one Hall of Fame position player has fewer than 2,000 hits. Could another do so? Could we elect a defensive wizard whose offensive statistics pale in comparison to the averages?
There are many questions we have yet to answer, but that we will over time. We’re a relatively young world, but it is exciting each year to draft talent, to watch those players progress, win awards, and meet milestones, and later to determine if they did enough to make the Hall.

