As we make our decisions regarding Hall of Famers, here is some information about our current Hall of Famers, as well as our current nominees, that may help you fill out your ballot.
A. Current Hall of Famers and Statistics
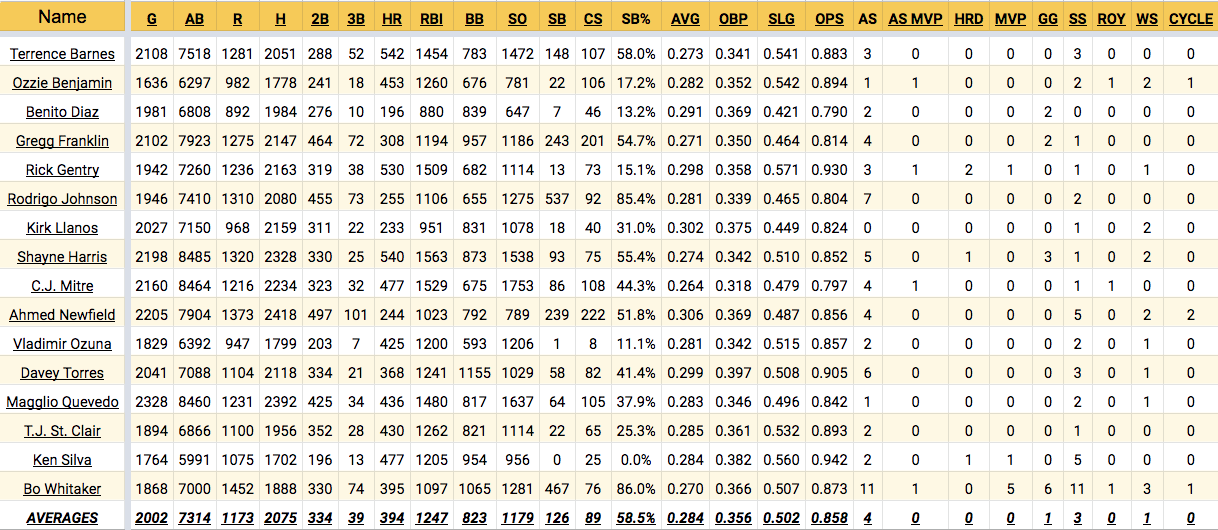
Position Players

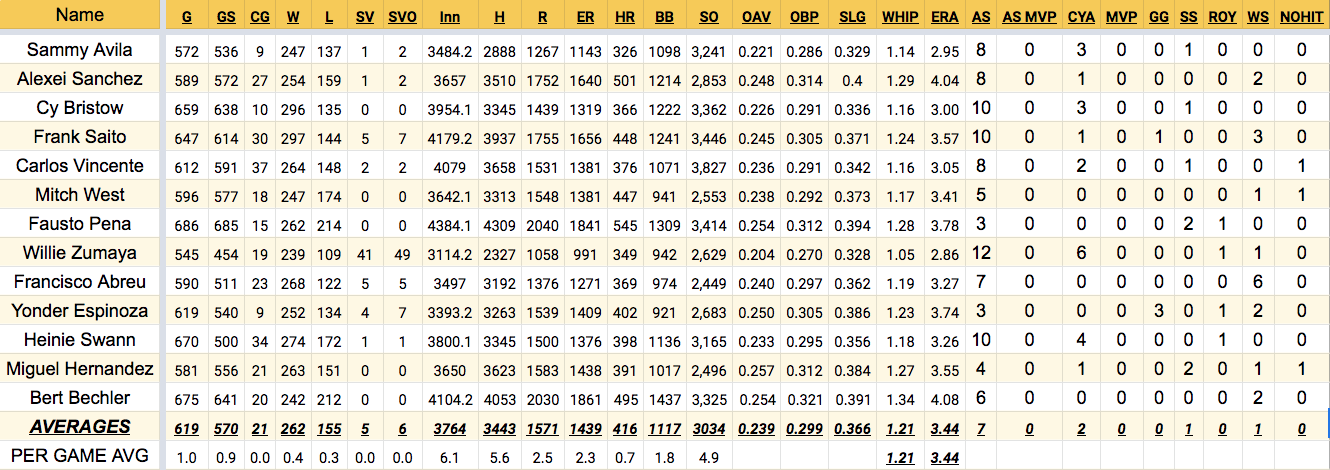
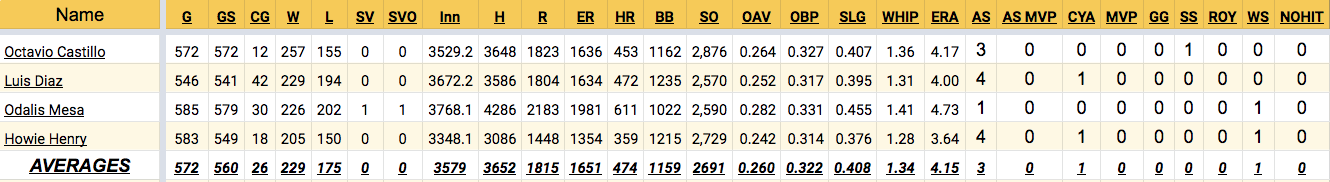
Starting Pitchers

Relief Pitchers

Hall of Fame Composite
Position Players
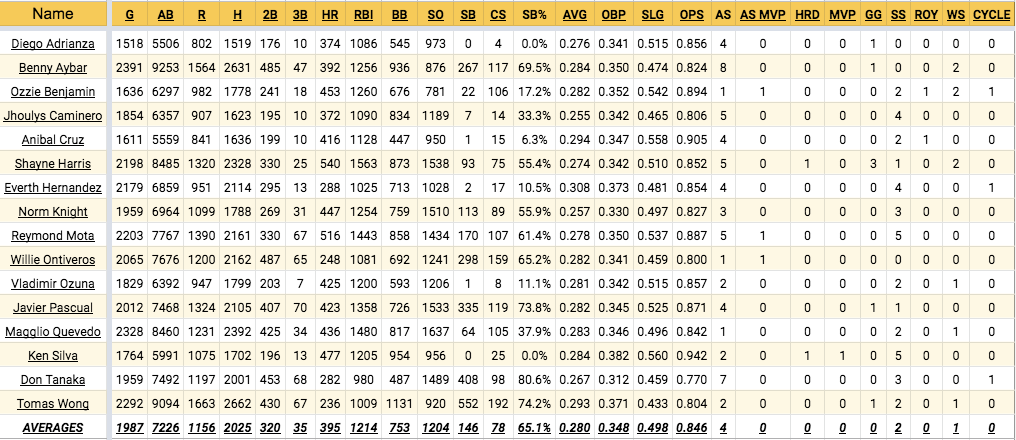
The average Hall of Fame position player was a heart of the order hitter, with 2,447 hits (-48, compared with our last write-up in Season 37, pre-Hall of Fame induction), 395 doubles (-14), 494 home runs (+4), 1,504 RBI (-5) and a 0.887 (-0.003) on base plus slugging (OPS, excluding hit by pitch or sacrifice data). Additionally, the average Hall of Fame position player made seven All Star appearances, won one MVP, one Gold Glove, four Silver Sluggers, and won one World Series ring (-1).
On a per game basis, the average Hall of Fame position player accrued 1.1 hits in 3.7 at bats, doubled and homered at roughly equivalent rates (0.2 each), scored and batted in 0.7 runs, and walked 0.4 times compared with 0.6 strike outs.
Starting Pitchers
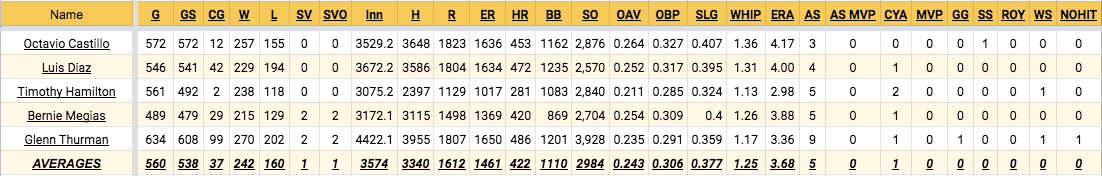
The average Hall of Fame starting pitcher demonstrated excellent control, winning 258 games (-4) and losing 152 (-3), collecting 3,019 strikeouts (-15) against just 1,092 walks (-25), and throwing to a 1.20 WHIP (-0.01) and 3.41 ERA (-0.03). The average SP made seven All Star appearances, won two Cy Young Awards, one Silver Slugger, and one World Series ring.
On a per game basis, the average Hall of Fame starting pitcher went six innings, allowed 5.5 hits (-0.1), 1.8 walks, and 2.3 earned runs while striking out 4.9.
Relief Pitchers
The average Hall of Fame relief pitcher was a reliable back-end bullpen arm, averaging 508 saves (+41) out of 590 opportunities (+42), converting on 86.1% of chances (+0.9%) in 979 total appearances (-10). He allowed 1.20 baserunners per inning pitched (+0.01) and kept a 3.19 ERA (+0.02). He averaged nine All Star appearances (+1) and two Fireman of the Year awards (-1), but no World Series rings (-1).
On a per game basis, the average Hall of Fame reliever pitched an inning, allowed a hit, 0.4 walks and 0.4 earned runs, and struck out 0.9.
B. Hall of Fame Nominees and Statistics
Position Players
Starting Pitchers
Relief Pitchers

Comparison
Clearly, the averages for all three groups are significantly lower than our current group of Hall of Famers in virtually every category. However, several players rank as above average, compared with current Hall of Famers, in various categories, including some who would rank in the Top 5 of some categories if elected. Those will be outlined below.
In the meantime, it is important to remember that these are averages: some people fall above, and some people fall below, including current Hall of Famers. Simply falling below the average should not be the sole basis for exclusion. I encourage all owners to look at each player holistically and vote on the merits.
Above Average Position Players
The tables below list each nominated position player and whether or not they were above average in a given category, when compared to current Hall of Famers, on both an absolute and per game basis.
Above Average When Compared with Hall of Famer Statistical Averages
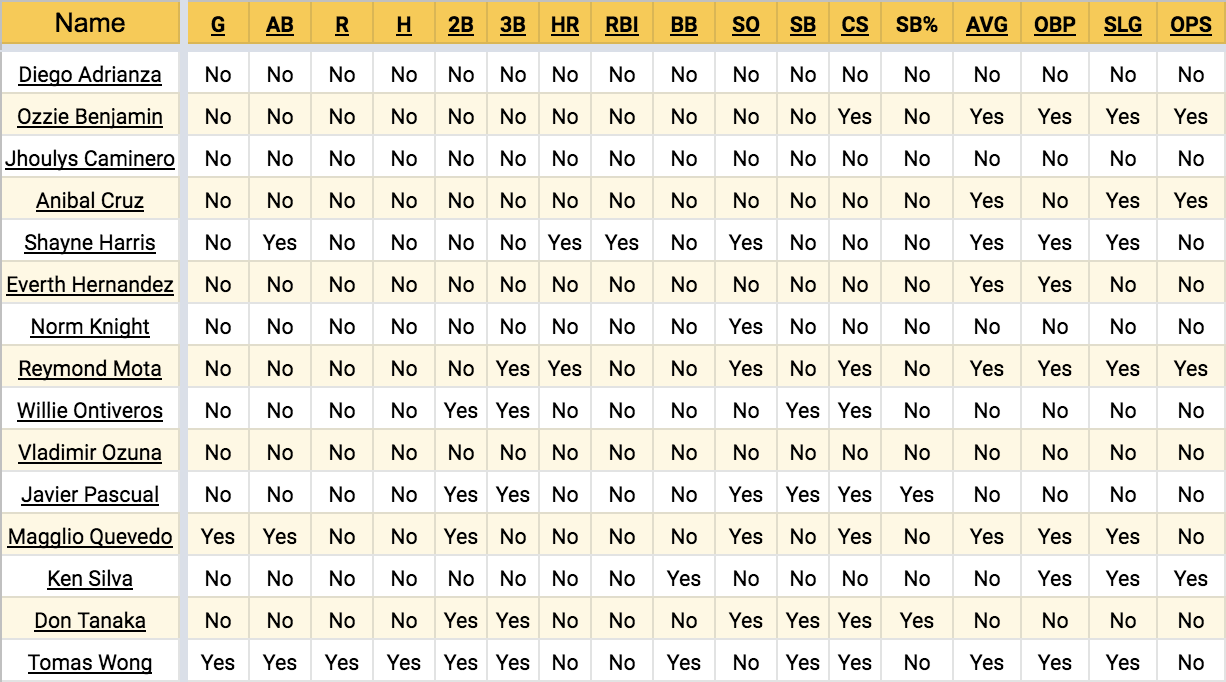
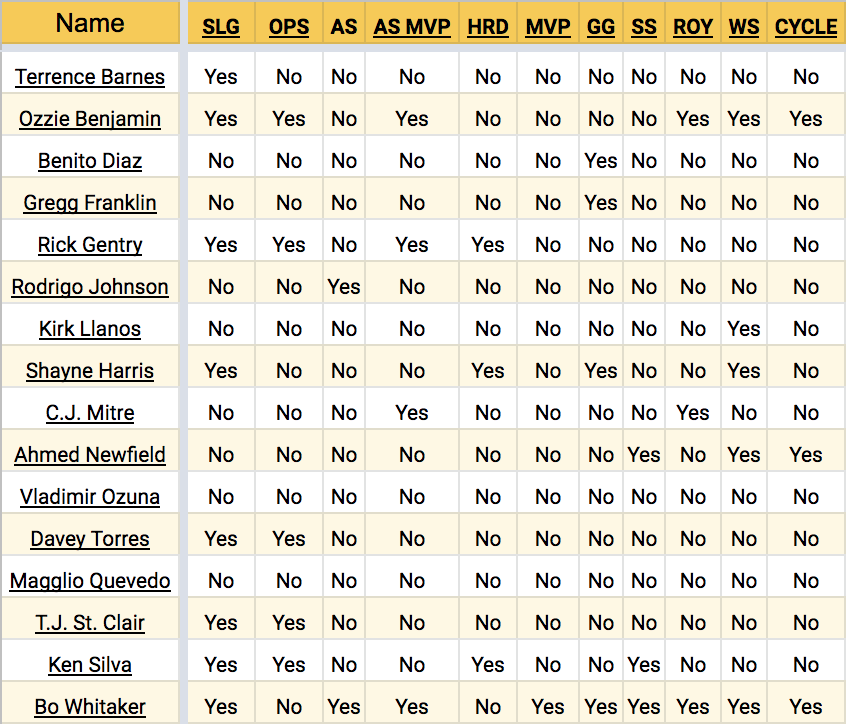
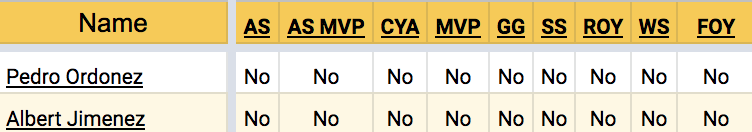
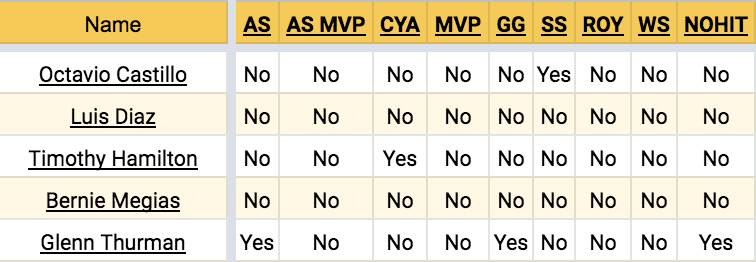
Above Average When Compared with Hall of Famer Award Averages

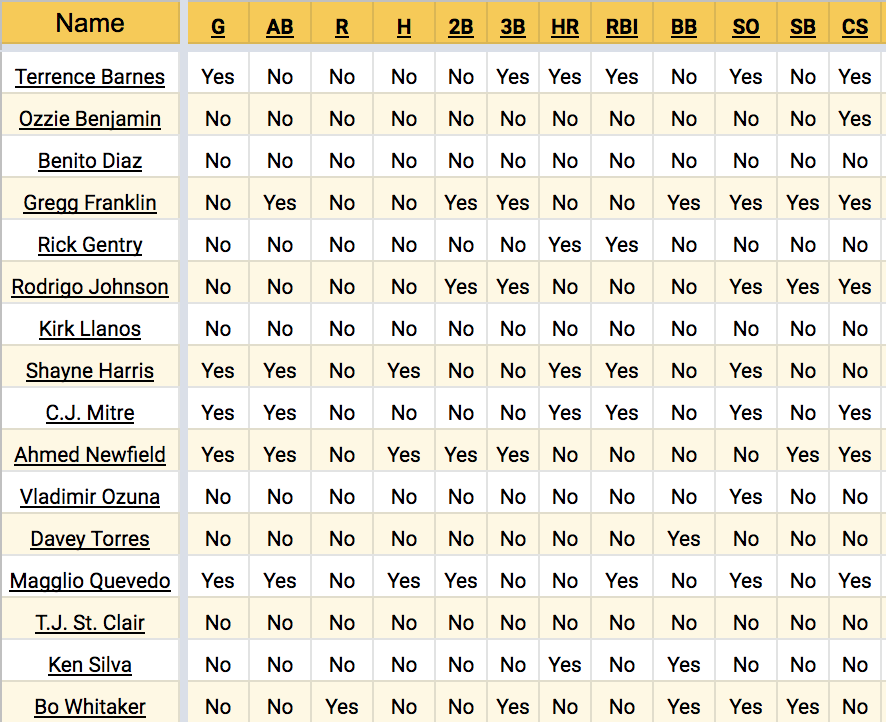
Above Average When Compared with Hall of Famer Per Game Averages

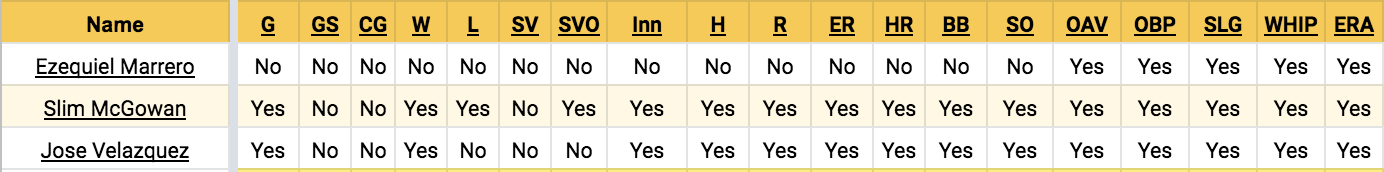
Above Average Starting Pitchers
The tables below list each nominated starting pitcher and whether or not they were above average in a given category, when compared to current Hall of Famers, on both an absolute and per game basis.
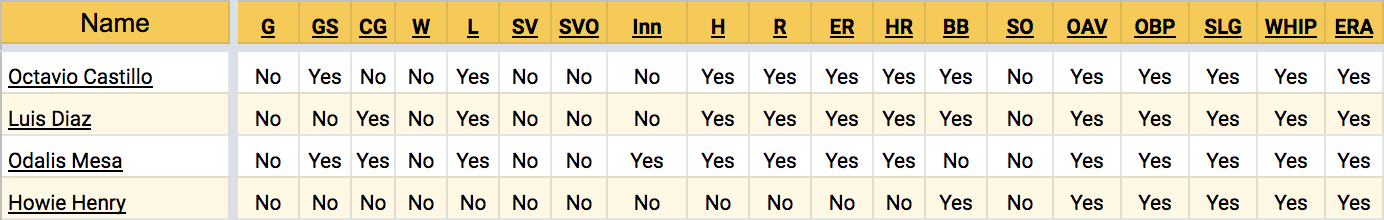
Above Average When Compared with Hall of Famer Statistical Averages

Above Average When Compared with Hall of Famer Award Averages
Above Average When Compared with Hall of Famer Per Game Averages

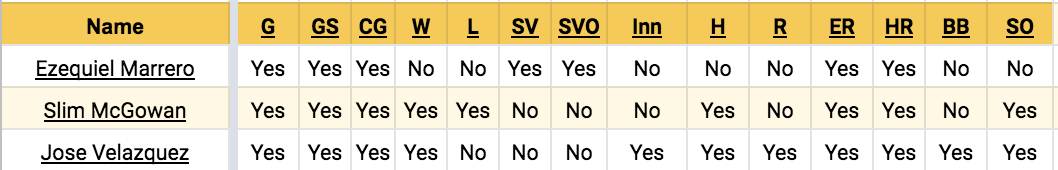
Above Average Relief Pitchers
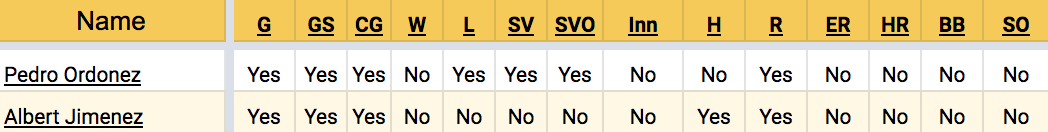
The tables below list each nominated relief pitcher and whether or not they were above average in a given category, when compared to current Hall of Famers, on both an absolute and per game basis.
Above Average When Compared with Hall of Famer Statistical Averages
Above Average When Compared with Hall of Famer Award Averages

Above Average When Compared with Hall of Famer Per Game Averages
C. Analysis
Position Players
Among nominated position players, Tomas Wong leads the field in terms of categories in which they surpass the Hall of Fame statistical and award averages, with 12. Shayne Harris and Reymond Mota are next with 10 apiece, followed by Ozzie Benjamin with nine.
On a per game basis, Wong leads with 9, followed by Javier Pascual with 8 and Don Tanaka with 7.
Only three nominees average more hits per game than the current Hall of Famers: Benny Aybar, Benjamin, and Wong. Eight averaged more home runs: Diego Adrianza, Benjamin, Anibal Cruz, Harris, Norm Knight, Mota, Vladimir Ozuna, and Ken Silva. Just six average more RBI per game: Adrianza, Benjamin, Cruz, Harris, Pascual, and Silva.
Only Tanaka met the average number of All Star appearances by current Hall of Famers, with seven. Only Silva won an MVP (1). Mota and Silver lead all nominees with Silver Sluggers (five each), followed by Jhoulys Caminero and Everth Hernandez with four.
Starting Pitchers
Among the starting pitchers in this year’s class of nominees, only Glenn Thurman ranks as above average in terms of wins, although three of the five did lose more games than the average Hall of Fame starter (Octavio Castillo, Luis Diaz, and Thurman). Timothy Hamilton and Bernie megias are the two not to have done so. Two of the five starters were better than the current Hall of Famers with respect to opponent averages, opponent on-base percentages, opponent slugging percentages, WHIPs, and ERAs: Hamilton and Thurman.
Thurman is the only current nominee to have pitched more innings and have collected more strikeouts than the average Hall of Fame starter. Thurman leads the class with 3,928 punchouts in more than 4,400 IP. He also leads the class in wins with 270. Hamilton, who threw the least IP of the five (3,075.2), is third in strikeouts with 2,840 and is the only candidate with a career ERA under 3.00 (2.98). Hamilton also carries the lowest number of losing decisions (118) and leads the nominees in WHIP (1.13).
In terms of awards, only Thurman exceeded the average number of All Star appearances (7) with nine, followed by five each for Hamilton and Megias. Hamilton is the only nominee to have won multiple Cy Young Awards (2), though Diaz, Megias, and Thurman each won one. Hamilton and Thurman are the only two to have pitched their clubs to World Series titles. Thurman also threw a no-hitter.
On a per game basis, only Hamilton allowed fewer hits, runs, and home runs than those starters already in the Hall of Fame. Only Diaz threw fewer strikeouts per game than the average Hall of Fame starter.
Relief Pitchers
Among relievers, no closer has saved more games than the average Hall of Famer. Conversely, Jose Velazquez spent more time as a set-up man, with more appearances than the average reliever, despite fewer saves and opportunities.
Ezequiel Marrero is the only reliever to have accrued accolades to the same level as current Hall of Famers, with six, though both he and Slim McGowan made their share of All Star games, attending four apiece. Opponents also fared better against each reliever.
On a per game basis, only Marrero was demonstrably better than those closers already enshrined, allowing fewer hits and walks, and accruing more saves.
D. Hall of Fame Benchmarks
Among hitters, a number of statistical benchmarks appear to be coalescing. I made a determination on these by calculating the number at or above which 75% of current Hall of Famers ended their careers.
The position player benchmarks are as follows:
Statistical Category | Number |
Hits | 2,222 |
Doubles | 332 |
Home Runs | 421 |
RBI | 1,353 |
Batting Average | 0.280 |
OPS | 0.863 |
All Star Appearances | 5 |
Silver Sluggers | 2 |
Therefore, one might expect that any position player accruing at least these statistics and winning at least this amount of awards, would have a good shot at being elected to the Hall of Fame.
The benchmarks for starting pitchers are as follows:
Statistical Category | Number |
Wins | 247 |
Innings Pitched | 3,487 |
K | 3,019 |
WHIP* | 1.26 |
ERA* | 3.69 |
All Star Appearances | 5 |
Cy Young Awards | 0 |
* These categories were determined using the third quartile, i.e. finding the level at which 75% of Hall of Famers fell at or below over their career.
Therefore, one might expect that any starting pitcher accruing at least these statistics and winning at least this amount of awards, would have a good shot at being elected to the Hall of Fame.
The benchmarks for relief pitchers are as follows:
Statistical Category | Number |
Saves | 478 |
Innings Pitched | 955 |
K | 811 |
WHIP* | 1.24 |
ERA* | 3.53 |
All Star Appearances | 7 |
Fireman of the Year Awards | 1 |
* These categories were determined using the third quartile, i.e. finding the level at which 75% of Hall of Famers fell at or below over their career.
Therefore, one might expect that any starting pitcher accruing at least these statistics and winning at least this amount of awards, would have a good shot at being elected to the Hall of Fame.
E. Notes and Lingering Questions
It’s easy for us to think of our Hall of Famers in the context of Major League Baseball: 3,000 hits, 300 wins. The fact of the matter, though, is that longevity in Hardball Dynasty is highly variable, and a career that lasts longer than a solid decade is hard to come by. Despite this, Upper Deck has a long history and we have, through our voting patterns, determined what benchmarks, on average, we deem to be worthy of enshrinement.
Many of the players in this year’s class do happen to fall below Upper Deck’s own historical averages. That said, the way that we vote this year will shift those averages in one direction or another, and just because a player is below those numbers does not mean he is not worthy.
How long was the player’s peak? How strong was it?
No Hall of Fame pitcher has ever won the Most Valuable Player award. Should a starter who wins the MVP be a shoo-in for enshrinement? Should a reliever who wins the Cy Young be a shoo-in? Could a shut down reliever who never closed games be elected?
Only one Hall of Fame position player has fewer than 2,000 hits. Could another do so? Could we elect a defensive wizard whose offensive statistics pale in comparison to the averages?
There are many questions we have yet to answer, but that we will over time. It is exciting each year to draft talent, to watch those players progress, win awards, and meet milestones, and later to determine if they did enough to make the Hall.
F. Future Directions
In the future, as our Hall of Fame inducts more players, I intend to break things down by position, as Hall of Fame second basemen would look quite different, statistically, from Hall of Fame catchers, for example. This is complicated by the fact that many players change positions as their skill sets evolve, so I will probably consider players to be a certain position based on time spent at the position (innings played), with some consideration to where their Gold Glove awards were won, if applicable.